Your traction slide has three customer logos, a growth percentage and a screenshot of a dashboard. Each element is real, but a reader still cannot tell how the business is progressing.
Before adding another metric, decide what the slide is meant to establish. Are people trying the product? Are they returning? Are they paying? Does growth continue when someone other than a founder brings in the customer? Each question calls for different evidence.
Choose a claim you can support.
Start by completing this sentence: “The evidence we have today suggests…” Then name the behaviour you can actually observe. Be precise about its limits.
Invented example
“Eight of our twelve pilot teams used the product in each of the last four weeks.”
That statement is useful because it identifies a group, an action and a period. It also leaves room for sensible follow-up. What counts as use? Are the pilots paid? How much help did the teams need? The slide should make those questions easy to answer.
A title such as “Strong customer engagement” asks the reader to supply both the definition and the conclusion. Use the headline to say what happened. Put the definition close to the chart.
Keep the denominator in view.
Suppose a company says that 80% of its customers are active. That could mean four of five accounts, eighty of a hundred or eight hundred of a thousand. It could describe a login yesterday or a completed workflow during the past month.
Show the count as well as the percentage when the group is small. State whether the unit is a person, a team, an account or a company. Explain the action that counts as active, and use the same definition across the deck.
Label commercial categories carefully too. An unpaid pilot, a signed paid contract, invoiced revenue and cash collected describe different events. The distinctions between bookings, recognised revenue and recurring revenue in a16z’s metrics guide are useful when checking your labels. If a logo represents a pilot, say so. If a number includes services work alongside software subscriptions, show the split when it changes the interpretation.
Make the chart prove the headline.
Consider a fictional company with monthly recurring revenue of $10,000 in January, $12,000 in February, $15,000 in March and $20,000 in April. An accurate headline is “Monthly recurring revenue doubled from January to April.” The increase is $10,000 on a $10,000 starting base: 100% growth.
Inspect the data and calculation
| Month | MRR | Change from January |
|---|---|---|
| January | $10,000 | — |
| February | $12,000 | 20% |
| March | $15,000 | 50% |
| April | $20,000 | 100% |
Example source note: Billing records; month-end; excludes services. All values here are invented.
A simple time-series chart can carry that claim. Label the months, the currency and the metric. Keep the visual treatment consistent across the period. Give the latest value enough emphasis to find it quickly, and keep earlier values readable.
If you use bars, a zero baseline lets their lengths represent the values directly. A line chart can use a tighter range when small changes matter; Datawrapper’s line-chart guide shows when a zero baseline is optional and how much the chosen range changes the impression. Make the scale obvious so the visual does not suggest a larger change than the numbers support.
Include a short source note, such as “Billing records; month-end; excludes services.” Keep the reconciliation in the appendix. The reader should be able to understand the chart without opening a spreadsheet, and trace the number when they want more detail.
Explain the event that changes the reading.
Growth may be concentrated in one customer or follow a single promotion. A product launch may create a temporary jump in signups. If an event explains a material change in the chart, annotate it or add one sentence beneath the figure.
For the fictional revenue example, one new customer might account for most of April’s increase. Showing that concentration gives the reader a better basis for judging what has happened and what you still need to learn.
When groups behave differently, separate them. A total usage line can rise while older customers leave, because new signups replace them. A cohort view can help answer the narrower question of whether a given group keeps returning. Use it when retention is the claim you need to support.
Show what you have at an early stage.
If you have little or no recurring revenue, show the strongest relevant evidence available: a completed technical test, repeated product use, a paid experiment or a detailed account of a customer workflow. Label its status and explain what it allows you to conclude.
A technical milestone may matter greatly to a company whose immediate risk is feasibility. Interviews may explain the problem well while leaving willingness to pay unresolved. Do not stretch one kind of evidence to answer every question.
Edit the slide in this order.
Write the claim, choose the metric, define the group and period, and check the calculation. Then draw the chart. Remove any logo, percentage or screenshot that does not help the reader judge that claim.
Keep a separate source table containing the values, definitions and extraction date. It makes later updates easier and reduces the chance of two versions of the deck telling different stories. The finished slide should let someone describe what changed, how you measured it and what remains to be proved.
See the slide in context.
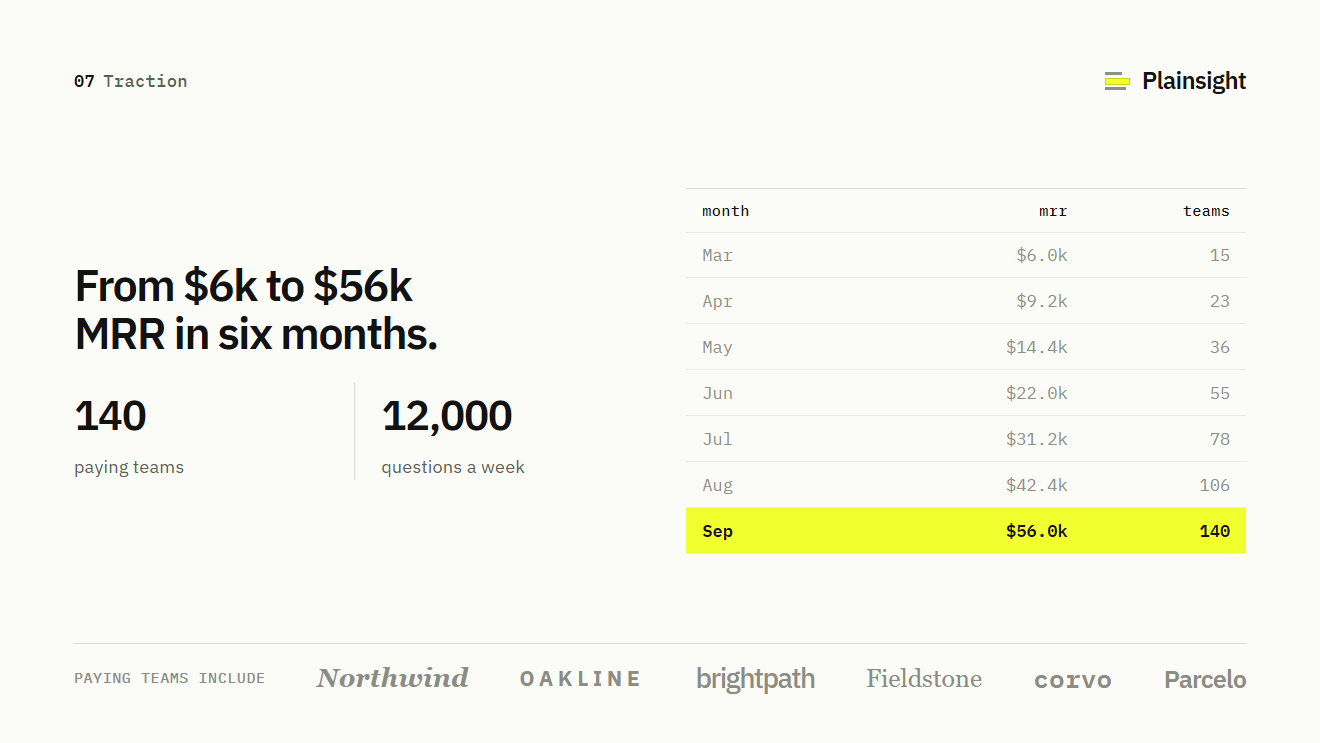
The headline states the revenue claim and the table shows the trend month by month. To assess it, a real deck would also need the metric definition and the underlying source.
Open this slide in the full example deck
Put it to work / TPD exercise
Build a defensible traction slide.
- Choose a claim before a chart.
- Check the unit, period and denominator.
- Recalculate growth and label the source.